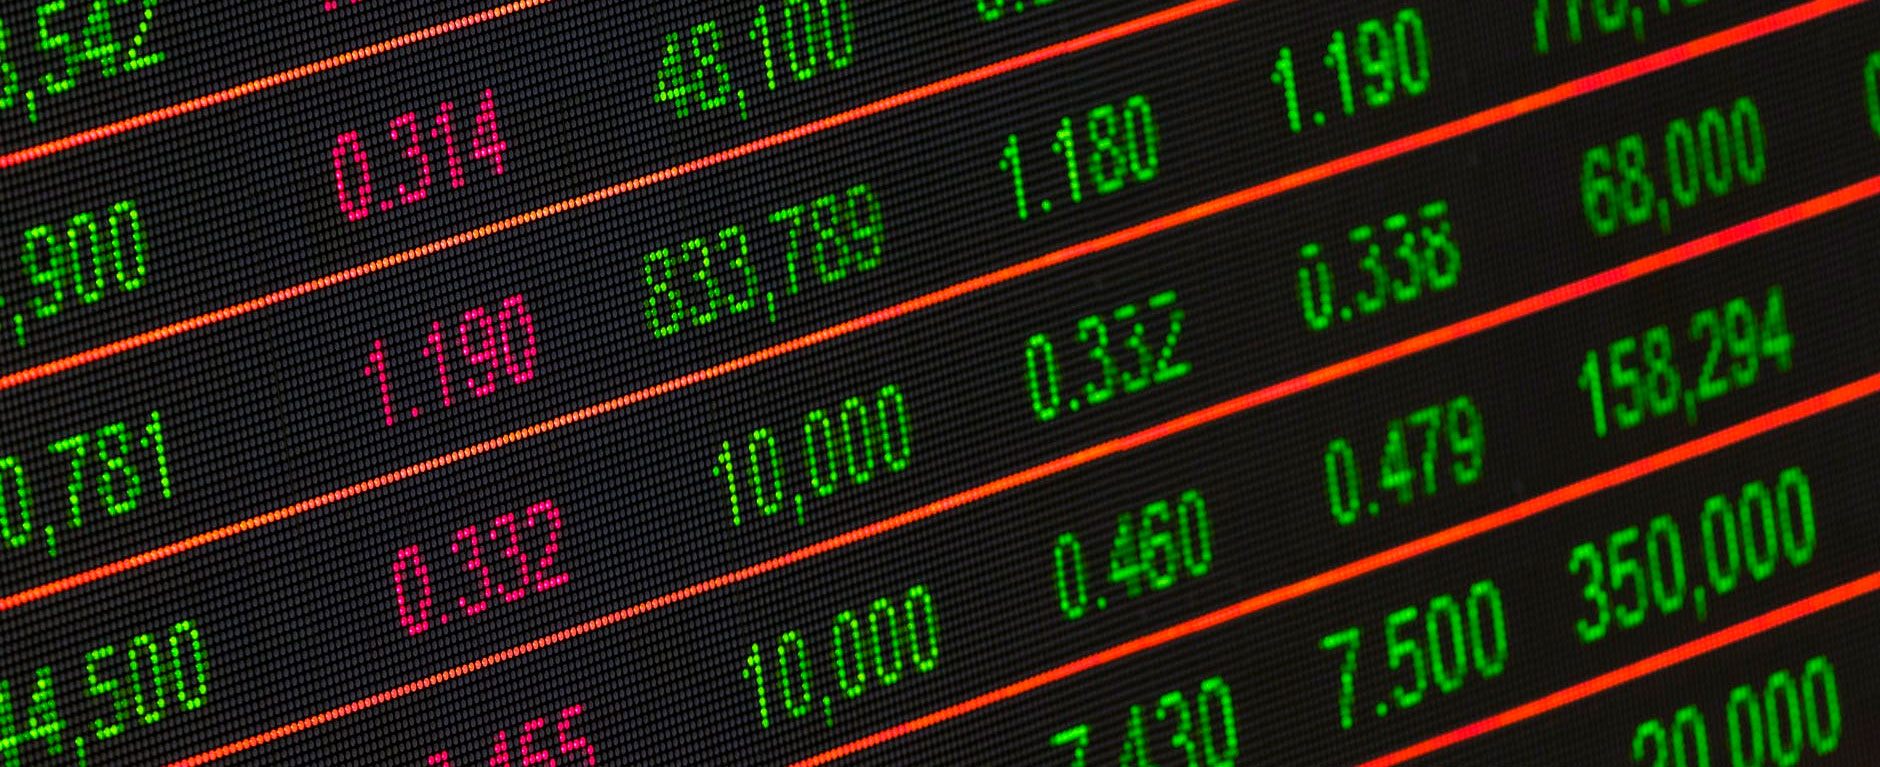
Financial Charting
Financial charting involves the graphing of market variables. Financial advisors often graph stock prices and market averages to predict trends in prices. Stock charts, the most common type of charts in the financial industry, are price charts that plot stock prices over a certain period. In addition to stock prices and market averages, charts are also formulated for:
- Commodity prices
- Interest rates
- Trading volume
The main objective of these charts is to determine trends to project the future values for your investment purposes. Stock charts gather key information about a stock’s price over time to present financial trends that help your advisor make the best investments for you. Financial advisors follow these trends to deliver the highest quality services to their clients.
Key Information in Charting
The following information is displayed through financial charting:
- The stock symbol and the exchange that the stock trades on.
- The chart period which is displayed daily, weekly, monthly, quarterly, or annually. Most investors use a weekly or monthly chart to spot long-term price trends that they can capitalize on.
- Each day’s trading displays four data points. The start of the day price is called the open. The close is the price at the end of the day. The high and low show the highest and lowest price during the day.
- The net change since the previous price is also displayed in a stock chart.
- Charts are divided into three types: line, bar, and candlestick charts. Line charts help to display how a price is behaving by plotting the closing price. Bar charts plot the open, high, low, and close with bars for each day. Candlestick charts show the same information as bar charts but in a more visually appealing way.
- Finally, charts show the volume of a stock. The volume is the amount of stock that has been bought and sold over a period of time. Volume may predict whether a stock trend will continue.
How Will Charting Help Me?
Financial charting is the single most important investing skill of successful financial investors. It provides the information needed to identify the right time to buy, sell, or hold onto your stock positions. A financial investing service that uses charts to predict your best option will help bring you the most financial success when you invest. You want to combine the best techniques to set you on the path towards your financial goals. As skilled professionals who know how to use charts to your advantage, we implement the best tactics to deliver an investment strategy that optimizes your financial success.